How to optimise your marketing spend with Meridian
Optimising Marketing Spend with Google's MeridianGoogle's new Marketing Mix Model, Meridian, offers a fresh approach to understanding and optimising marketing investments. In my latest article, I explore how Meridian leverages Bayesian inference to provide actionable insights into channel performance, ROI, and budget allocation.While it requires some technical setup, the potential benefits for strategic decision-making are substantial.If you're interested in data-driven strategies to enhance your marketing effectiveness, this piece provides a practical overview.
In January 2025 Google announced their new Marketing Mix Model named Meridian. It’s predecessor named LightweightMMM has been on my list of things to investigate for a while, but such is the pace of technology development these days that it seems like I’ve missed the starter and so I’ve headed straight for the main course. So in this article we’ll take a look at what Meridian can do, by training it to optimise the digital marketing budget of a UK business.
What is Meridian?
Meridian is a customisable MMM framework that enables advertisers to develop and run their own in-house models. Built on Bayesian causal inference, Meridian can handle large-scale geographical-level data and is also suitable for national-level modelling. It assists in answering critical questions, such as:
-
How do different marketing channels contribute to revenue or other KPIs?
-
What is the return on investment (ROI) for various marketing activities?
-
How can future marketing budgets be optimised for better performance?
Meridian offers clear insights and visualizations to inform marketing budget and planning decisions. Additionally, it supports the calibration of MMM with experimental data and other prior information, and it facilitates the optimisation of advertising frequency by utilising reach and frequency data.
Meridian is not unique in the MMM world, there is Robyn from Meta, but Meridian builds on the work of research teams at Uber who used their Orbit platform to create powerful Bayesian based MMM. Bayesian is a mathematical probabilistic paradigm, and the important things that you need to know about it are that it comes with the following advantages:
-
They are very interpretable and consequently it’s easy to explain the predictions it makes.
-
It allows for a certain amount of domain knowledge to be ingested into the model before it is trained, which can allow it to understand the complex relationships of dynamic systems that we see in marketing activities.
-
It provides uncertainty quantification - or in other words it tells you how sure it is of the predictions it is making which therefore helps you understand how well you should trust its recommendations.
What can it do?
Now the Meridian team at Google provided some sample notebooks and a synthetic database to demonstrate its capabilities, but I think using real data really helps to bring it to life, however finding publicly available corporate marketing spend data seems to rarer than hen’s teeth. I did find such a dataset hidden in a github repo - whether it is real or not I don’t know, but it certainly looks real and that’s the main thing. The data is the marketing spend of a UK business in 3 geographical locations (London, Birmingham and Manchester) across the 3 digital channels ( Facebook, Instagram and Pinterest). The model is tasked with using the impression data from each channel to then infer the revenue per conversion for each channel and geographical location.

I’ll spare you the details of the process of actually doing the model training, but essentially you need to write some code in Python to do the work - there’s no application, so this isn’t CMO friendly out of the box, but with the help of your friendly neighbourhood AI consultant a bespoke system could be created for you.
The best part is that once the model has been created the framework provides a set of visualisations that really help you understand what’s going on with your marketing spend and it’s this that I want to focus on.
The visual is a bar chart which compares the relative spend and revenue across each channel. Not that these values are percentages rather than absolute values so it’s useful for comparing the differences between each channel. The story here is that most of the budget goes on Facebook which also gives the highest ROI as indicated by the green bar lines.

Following on from this we look at two bubble charts. The first compares ROI vs Effectiveness. Effectiveness is defined as incremental revenue per impression. High ROI does not necessarily imply high effectiveness. Conversely, low spend does not necessarily imply low effectiveness. The size of the bubble indicates the spend on each channel.

The second bubble chart looks at ROI vs Marginal ROI where marginal ROI is the predictive return on investment from an additional unit spent. Marginal ROI is an indicator of the efficiency of additional spend. For example, channels with high ROI but low marginal ROI are likely in the saturation phase. So any additional investment won't likely bring in the return that the initial investments did. Conversely, channels with high ROI and high marginal ROI perform well and will likely continue to yield high returns with additional spending.

The next chart give us an indication of how confident the model is in its predictions. The first bar chart displays the ROI per channel but the lines give us a credible interval ( like confidence interval ). A 90% credible interval means that in 90% of the models simulations the ROI has been in the range denoted by the lines. Facebook has the smallest credible interval (ie the model is more confident in it’s prediction) and Pinterest has the largest credible interval (ie the model is the least confident in its prediction).
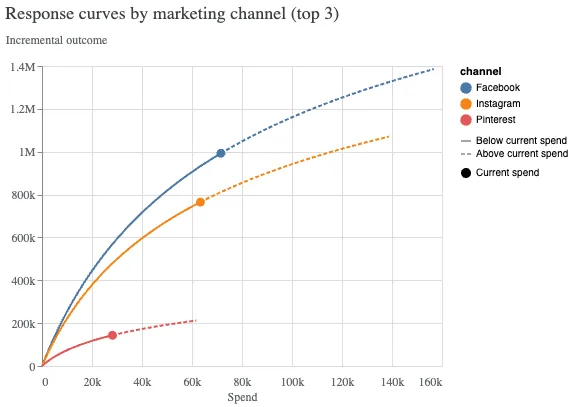
Now we start to get on the really cool stuff - response curves. So the idea here is that it gives us a visual indication of how our ROI would change with changes to spend across each channel. All channels exhibit a point of saturation - or in other words they suffer from diminishing returns meaning that as you increase spend in any channel, the effectiveness reduces.

In this case we’re seeing that the Facebook channel looks like it would still be the most effective channel even though it already has the most spend, and Pinterest, despite having the lowest spend is already reaching a point of saturation.
Recommendations
Let’s cut to the chase shall we. What’s great about Meridian is that it provides some functionality that optimises the spend and predicts what the effect of making spending changes to the channels would be. The reality is for this dataset that the spend is already pretty well optimised, however the model predicts that it could be improved to add an additional £29K over a 9 month period - Look I know I was hoping for something a bit more compelling too, but hey I can’t change the data.
In terms of recommendations it’s proposing that we further increase spend on Facebook by 10K and make reductions in both Instagram and particularly Pinterest. The pie chart on the right tells us that it is recommending that we allocate more than 50% of the budget to the Facebook channel.


Finally we have a visual which shows us how these changes will take our revenue up from 1.90M to 1.93M.

Conclusion
In an era where marketing accountability is paramount, Google's Meridian framework offers a compelling solution for CMOs seeking to optimize their marketing spend. By leveraging Bayesian causal inference, Meridian provides nuanced insights into channel performance, ROI, and budget allocation, all while respecting user privacy. Its open-source nature ensures transparency and adaptability, allowing organisations to tailor the model to their unique needs. The visualisations and scenario planning tools further empower marketing leaders to make informed, data-driven decisions.
Ready to Transform Your Marketing Strategy?
If you're aiming to enhance your marketing effectiveness and drive better business outcomes, exploring Meridian could be your next strategic move. Whether you have an in-house analytics team or prefer to collaborate with experts, Meridian offers the flexibility and insights to elevate your marketing efforts.
Take the Next Step:
-
Contact us to talk about how Meridian can help your organisation